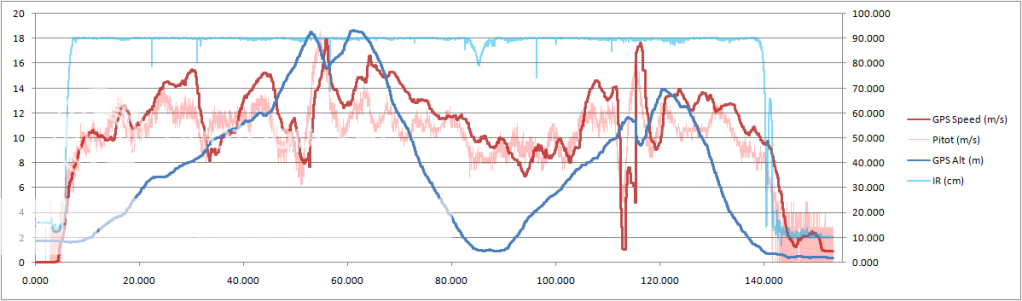
This is a graph showing basic telemetry data from the aircraft during a flight. The data is sent from the Arduino to the xbee radio, received by a ground station, logged, and then later processed with Excel. Of note, the pilot performed a low altitude pass at approximately 90 seconds into the recorded session, and the large spikes beginning around 110 seconds are from a vertical flip:
Click for a larger view.
No comments:
Post a Comment